
Rosenthal Correlation Coefficient
Explanation
This is a fairly easy coefficient to calculate. Rosnow and Rosenthal (2003, p. 231) label this as a partial correlation coefficient for contrast. It could for example be used as an effect size measure for a one or two-sample Wilcoxon test (Mangiafico, 2016; Simone, 2017).
It simply divides the standardized test statistics, by the square root of the sample size. It can therefor be calculated if a normal distribution was used. The formula can be found in Rosenthal's book (1991, p. 19), so I will refer to as the Rosenthal correlation coefficient (as to differentiate it with other correlation coefficients). Probably the original was Cohen (1988, p. 275) who calls it 'f', but all other authors label it 'r'
Cohen (1988, pp. 285-287) provides the following rules of thumb for Cohen f:
| f | Interpretation |
|---|---|
| 0.00 < 0.10 | Negligible |
| 0.10 < 0.25 | Small |
| 0.30 < 0.40 | Medium |
| 0.40 or more | Large |
| Note: Adapted from Statistical power analysis for the behavioral sciences (2nd ed., pp. 285-287) by J. Cohen, 1988, L. Erlbaum Associates. | |
Obtaining the Coefficient
with Excel
Excel file from video: ES - Rosenthal Correlation (E).xlsm
with stikpetE
without stikpetE
with Flowgorithm
A flowgorithm for the Rosenthal correlation coefficient is shown in Figure 1.
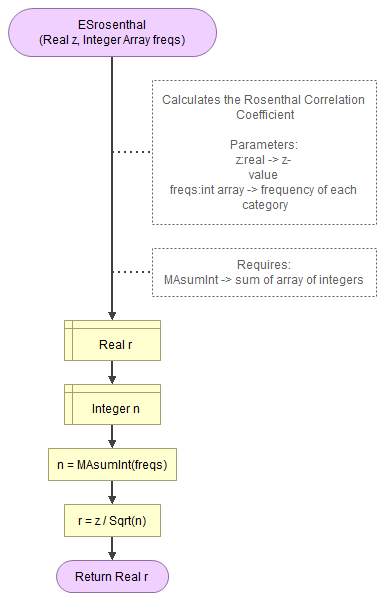
Flowgorithm file: FL-ESrosenthal.fprg
with Python
Notebook from video: ES - Rosenthal Correlation (P).ipynb
with stikpetP
without stikpetP
with SPSS
Datafile used in video: GSS2012-Adjusted.sav
Formulas
The Rosenthal correlation coefficient can be calculated using (Rosenthal, 1991, p. 19):
\(r = \frac{z}{\sqrt{n}} \)
Where \(n\) is the sample size, and \(z\) the z-statistic.
Google adds