
Pyramid, Butterfly, Tornado Charts
Explanation
To compare the counts from two categories across some other categories, a butterfly, pyramid, or tornado chart could be used. These create a simple bar chart for each of the two categories, and place the results back-to-back. They are a special case of divergent bar-charts. Depending on the order this might then look like a pyramid, tornado or no order (then sometimes called a butterfly chart). An example of each is shown in figure 1.
Figure 1
Example of a Butterfly, Pyramid and Tornado Chart
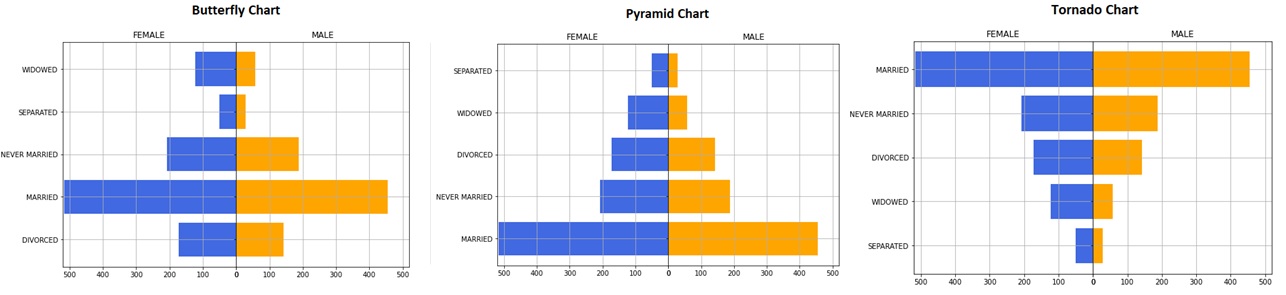
When the order of the bars is random, the chart is sometimes referred to as a butterfly chart (Hwang & Yoon, 2021, p. 25). If they are ordered with the smallest on top and the largest at the bottom, it creates the shape of a pyramid, and hence a pyramid chart (Schwabish, 2021, p. 185). If they are ordered with the largest on top and the smalles at the bottom, it is sometimes referred to as a Tornado Chart (Project Management Institute, 2013, p. 338) or a Funnel Chart (Jamsa, 2020, p. 135)
The name 'pyramid chart' is sometimes only referring a 'population pyramid' where some kind of demographic variable is split across two categories. It can also be used for a single variable with the bars stacked on top of each other. The name 'funnel chart' is also sometimes reserved for a specific diagram about publication bias (Everitt, 2004, p. 154)
Besides using categories, it is also possible to bin scale data, and then create these diagrams, although a back-to-back histogram might then be preferred.
Creating the Chart
for using nominal data as categories click here
with SPSS
To be Done
for using scale data and binning click here
with SPSS
Google adds