
Stem-and-Leaf Display
Explanation
A stem-and-leaf display is defined as: "a method of displaying data in which each observation is split into two parts labelled the ‘stem’ and the ‘leaf’" (Everitt, 2004, p. 362). A diagram that could be used to visualize scale variables.
To create the display a ‘stem’ unit and a ‘leaf’ unit are chosen. Each number is then listed accordingly. To illustrate, let’s say we have the following ages of some customers: 17, 21, 21, 23, 28, 29, 30, 33, 35, 39, 39, 44, 45, 47, 48, 50, 50
If we choose a stem unit of 10 and a leaf unit of 1 then for the first age of 17 the stem would be 1 and the leaf 7, for 21 it will be a stem of 2 and a leaf of 1, etc. This will create the stem-and-leaf display as shown in Figure 1.
Figure 1.
Example stem-and-leaf display
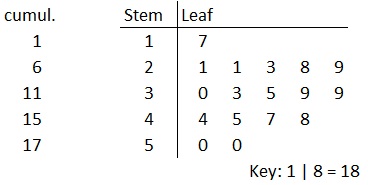
On the left hand side the cumulative frequency is shown, although this is not always added to the display. Note that the leafs in the example used are ordered also because the original numbers were ordered. In the original example from Tukey (1972, p. 296) the leafs are not ordered and remain in the order they appear in, nowadays the leafs usually do get ordered.
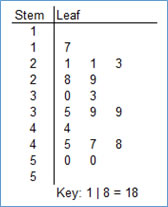
A variation that is sometimes used is a split stem-and-leaf display (Mann, 2024, p. 70). Each stem is listed twice, the first for all leafs less than 5 and the other for all leaves of 5 or more, creating a split stem-and-leaf display. In the example this will generate the chart shown in Figure 2.
Figure 2.
Example split stem-and-leaf display
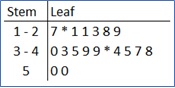
Another option is to bin the stems, and then use an asteriks (*) to separate each discrete value in the bin, creating a grouped stem-and-leaf display (Mann, 2010, p. 56). An example of this is shown in figure 3.
Figure 3.
Example grouped stem-and-leaf display
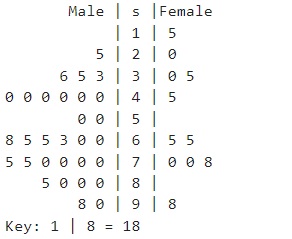
It's also possible to have the leaves from two samples shown. The stems are then in the middle and the leaves move out from there, for each sample in a different direction. The Cambridge dictionary of statistics defines a back-to-back stem-leaf plot as "a method for comparing two distributions by 'hanging' the two sets of leaves in the stem-and-leaf plots of the two sets of data, off either side of the same stem" (Everitt, 1998, p. 22).An example of this is shown in figure 4.
Figure 4.
Example back-to-back stem-and-leaf display
Creating the diagram
click here for the simple version
with SPSS
click here for the back-to-back version
with Python
Jupyter Notebook: VI - Stem-Leaf B2B (P).ipynb
with stikpetP:
To be Made
without stikpetP:
To be Made
Alternatives
Alternative visualisations for scale variables, are the histogram and box-and-whisker plot. When creating a histogram, a scale variable is actually converted to an ordinal variable by the bins and some of the information is lost. Figure 5 shows how to create a simple stem-and-leaf display, and how to convert it to a histogram.
Figure 5.
From stem-and-leaf display to histogram
Alternative visualisations for a back-to-back stem-and-leaf plot, could be an overlaid histogram, or a back-to-back histogram (pyramid chart)
Google adds