
Johnston-Berry-Mielke E
Introduction
This is an effect size measure that could be used with a goodness-of-fit test.
Johnston, Berry and Mielke (2006) proposed to simply divide the found chi-square value, by the maximum possible chi-square value. Something Cohen w (an alternative effect size measure) does not. The advantage of this measure is that it will therefor alway be between 0 and 1.
Unfortunately, I was unable to find any comparison with another potential effect size, the Cramér's V for Goodness-of-Fit. This measure is usually for tests of independence, but can also be used for goodness-of-fit tests.
The Johnston-Berry-Mielke E is (unfortunately) not widely known, so it is not often used.
Ben-Shachar et al (2023) derived a similar measure Fei פ, which turns out to be simply the square root of the JBM E, and might be preferred.
Obtaining the Measure
(click below on program of interest to expand)
with Flowgorithm
A basic implementation for Johnston-Berry-Mielke E in the flowchart in figure 1
Figure 1
Flowgorithm for Johnston-Berry-Mielke E
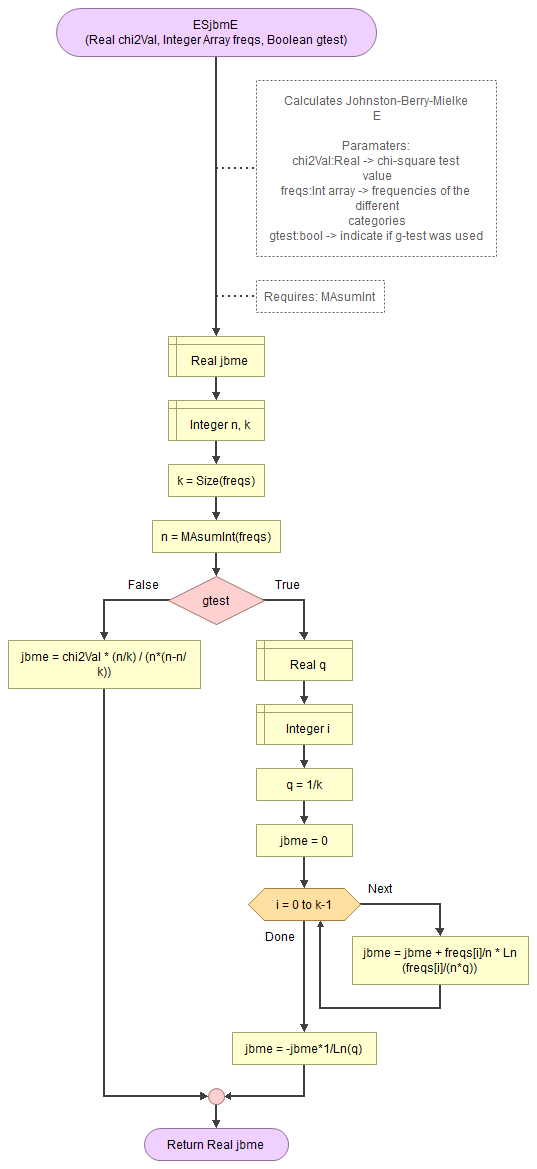
It takes as input the chi-square value, an array of integers with the observed frequencies, and a boolean to indicate if the g-test was used.
It uses a small helper function to sum an array of integers.
Flowgorithm file: FL-ESjbmE.fprg.
Formula
Johnston-Berry-Mielke E (Johnston, Berry, & Mielke ,2006, p. 413):.
\(E_{\chi^2}=\frac{q}{1-q}\times \sum_{i=1}^{k}\left(\frac{p_{i}^{2}}{q_{i}}-1\right)\)
\(E_{L}=-\frac{1}{\textup{ln}(q)}\times\sum_{i=1}^{k}\left(p_{i}\times\textup{ln}\left(\frac{p_{i}}{q_{i}}\right)\right)\)
In the above formula's \(p_i\) is the observed proportion in category \(i\), \(q_i\) is the expected proportion in category \(i\), \(q\) the minimum of all \(q_i\)'s, and \(k\) the number of categories.
Interpretation
Unfortunately, no rule-of-thumb could be found for this measure. However, it can be converted to a Cohen w measure, for which there are rules-of-thumb, or convert this further to Cramer V. The formula for the conversion:
\(w = \sqrt{\frac{E_{\chi^2}\times\left(1 - q\right)}{q}}\)
In this formula q is the minimum expected proportion.
Next step and Alternatives
Alternative effect sizes for a Goodness-of-Fit test could be:
If the test is significant a post-hoc analysis to pin-point which category is significantly different could be used. The post-hoc anlysis for a goodness-of-fit test is discussed here.

Google adds