
Pareto Chart
Note: if you prefer to watch a video on Pareto Charts click here
The Pareto Chart gets its name from the Pareto Principle, which is named after Vilfredo Pareto. This principle states that roughly 80% of consequencies come from 20% of causes (Pareto, 1896).
Unfortunately, there is no general agreed upon definition of a Pareto diagram. The most general description I’ve found was by Kemp and Kemp (2004) who mention it is a name for a bar chart if the order of the bars have no meaning (i.e. for a nominal variable), and they only mention that often the bars are then placed in decreasing order. According to some authors a Pareto diagram is any diagram with the bars in order of size (Joiner, 1995; WhatIs.com, n.d.), while others suggest that a line representing the cumulative relative frequencies should also be included (Weisstein, 2002). Upton and Cook (2014) also add that the bars should not have any gaps, but many other authors ignore this.
I will use the following definition: a bar chart where the bars are placed in descending order of frequency. Usually an ogive is added in the chart as well.
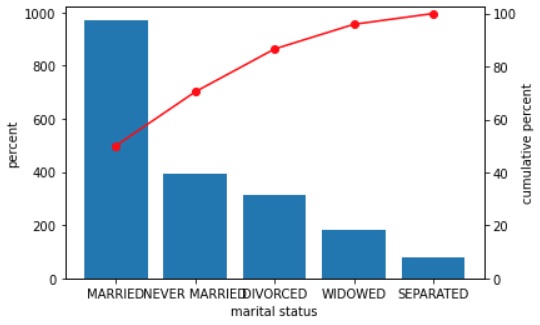
An ogive (oh-jive) is: "the graphs of cumulative frequencies" (Kenney, 1939). An example of a Pareto chart is shown in Figure 1.
Figure 1
Example of a Pareto Chart
Click here to see how to create a Pareto Chart
with Excel
Two different ways to go about this. A direct approach, or indirect but giving more control.
Direct
Indirect
The Excel file used in both videos: VI - Pareto Plot.xlsm
with Python
Jupyter Notebook used in video: VI - Pareto Chart.ipynb
Data file used: GSS2012a.csv
with R
with base only
Jupyter notebook: VI - Pareto Chart.ipynb
R code: VI - Pareto Chart.R
Data file used: GSS2012a.csv
with ggplot2
Jupyter notebook: VI - Pareto Chart (ggplot2).ipynb
R code: VI - Pareto Chart.R
Data file used: GSS2012a.csv
with SPSS
Data file used: Holiday Fair.sav
Reading dual-axis charts and also cumulative results requires the reader to be familiar with this. It is a bit more technical and that is why I would recommend using this only if you can assume the readers are familiar with this, and the Pareto Principle is indeed important for the analysis you are performing.

Google adds